Editor’s Note: Solugen, founded in 2016, is a biotech company concerned with developing environmentally conscious alternatives to chemical manufacturing. Their first patent is called Bioperoxide — a hydrogen peroxide alternative created entirely out of plants instead of petroleum. In October, they launched their first line of sustainably-minded consumer cleaning products called “Ode To Clean” — and with it, a blog. Rural America In These Times does not endorse any brands. The following repost, however, provides an interesting (and somewhat sick) look at the regional distribution of industrial toxins across the United States. Turns out, a majority of what the EPA calls “toxic releases” occur in rural areas.
In the company’s own words:
Every year, the U.S. Environmental Protection Agency (EPA) requires most large industrial facilities to report the volume of toxic chemicals they release into the environment. The EPA takes this data and consolidates it into the Toxic Releases Inventory (TRI), which is then used to set environmental policies in place. For this analysis, we looked at the EPA’s most recent TRI report, looking at data from 2016.
This includes data reported from more than 18,000 facilities across the United States, spanning major industries like manufacturing, mining, chemicals and utilities. It includes total releases (in pounds) of roughly 650 different toxins which are determined to have a significant adverse effect on humans and/or the environment. And in this report, “release” means that a chemical was “emitted to the air or water, or placed in some type of land disposal.
Here’s a look at the what, where and who was responsible for the bulk of toxic emissions in the United States in 2016.
First, a summary of their findings:
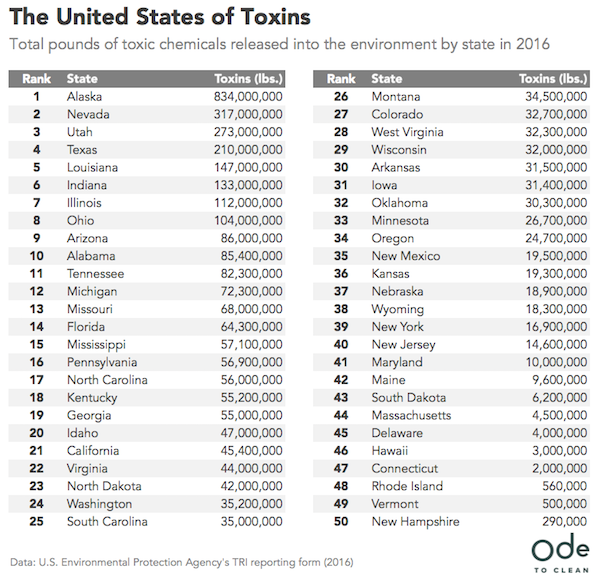
- As a state, Alaska produces the most toxins (834 million pounds)
- Zinc and lead compounds (common products of the mining industry) are the most common toxins
- Metal mining accounts for 1.5 billion pounds of toxins, while chemicals (515 million) ranks second
- On a county level, the Northwest Arctic of Alaska leads the list, but multiple Nevada counties round out the top 5
- Kotzebue, Alaska produces the most toxins as a city (756 million pounds), and Indianapolis, IN (10.9 million) produces the most out of the top 100 most populous cities
The data
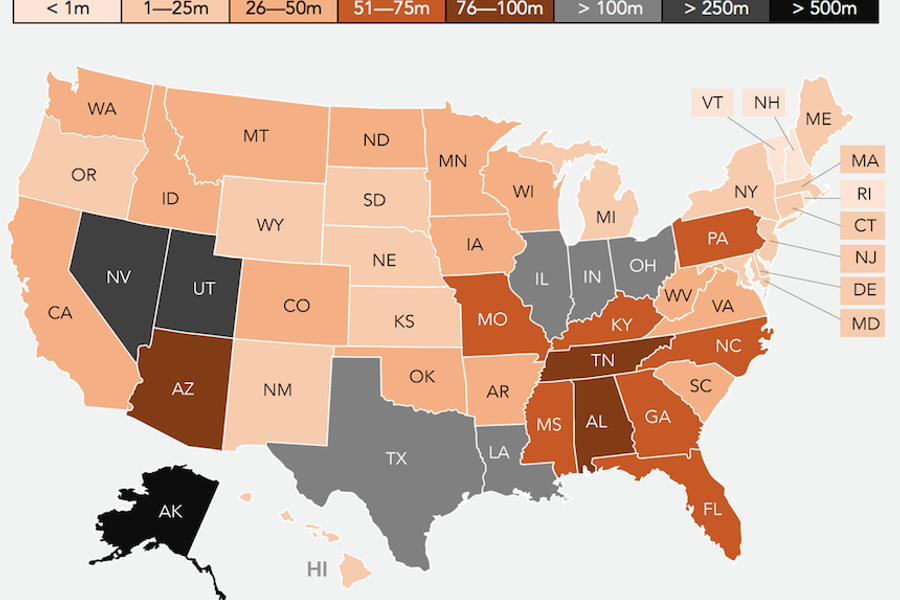
We began by tallying total toxin releases by state. This includes all toxins across all industries. On the mainland, we can see that Nevada and Utah facilities are especially detrimental to the environment — but a strip of states in the Rust Belt (Illinois, Indiana and Ohio), along with Texas and Louisiana, are also major players.
Alaska, though, handily outranks every other state by nearly 3 times.
A closer look, at a county level, reveals that 91 percent of Alaska’s toxin releases come from one county: Northwest Arctic, Alaska:
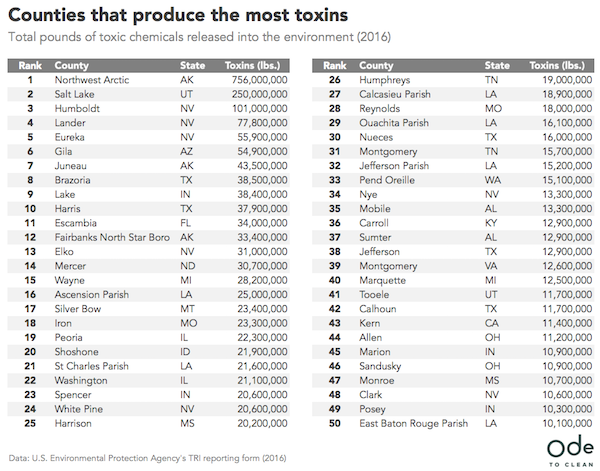
In fact, taking this one step further, we see that nearly all of these toxins originate from one city: Kotzebue, Alaska — a tiny town that is home to 7,500 people. Why? Just 90 miles from Kotzebue is Red Dog Mine, the largest source of zinc in the world, and a significant source of America’s lead. In operation since 1987, the mine is estimated to contain 77.5 million tons of zinc, lead and silver — and each year, its activities release 756 million pounds of toxins into the environment.
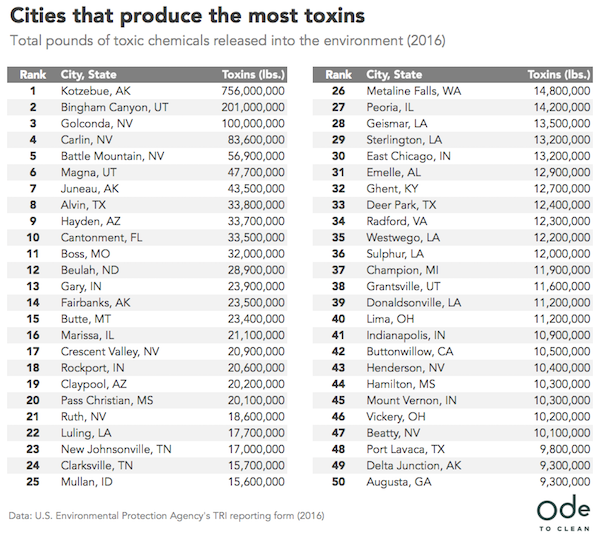
But these county and city lists have other stories to tell. Three of the top five cities — Humboldt, Lander and Eureka — are in Nevada. All are known to contain multiple, active gold mines that collectively release hundreds of millions of pounds of toxins.
Toxicity and population
It’s likely you haven’t heard of a lot of the cities on these lists — and that’s because most of the major industrial facilities in the United States are set up outside the limits of most major cities, far from large populations. So, let’s take a look just at the 100 most populous cities in the United States (according the Census data). The list below is sorted by population size.
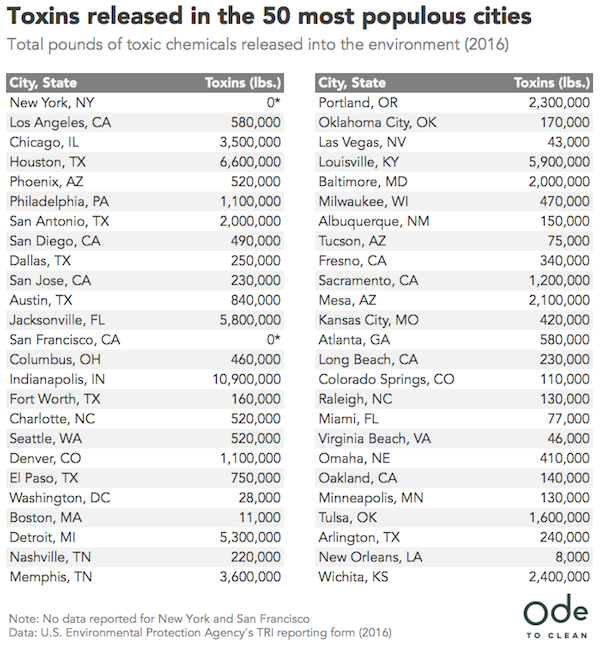
Interestingly, you’ll see that two of the largest cities in the country — New York and San Francisco — have no data listed. Only certain “qualifying” facilities are required to submit data (those that release over a certain threshold of particular toxins), so we hypothesize that this is either because: A) These cities don’t have qualifying facilities within city limits, since real estate is so valuable there, or B) The facilities that exist there just don’t meet the minimum emissions required to report data.
In any case, of the 50 most populous cities, Indianapolis leads the pack with 10.9 million pounds. The city has long been cited for its poor air quality, a result of steel mills, auto plants, and numerous coal-powered power plants that spew out arsenic, lead and mercury at alarming rates. But some of these cities are bigger than others, so it makes sense that they’d produce more toxins. Sticking with the 100 most populous cities, let’s look at toxins per square mile:
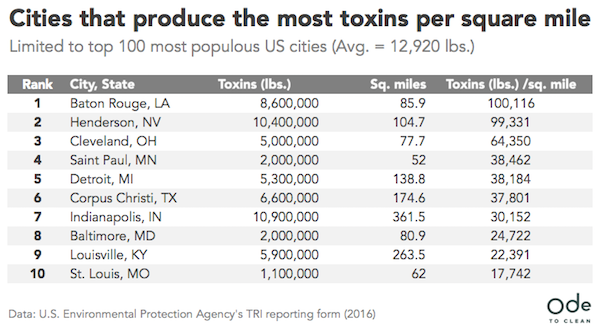
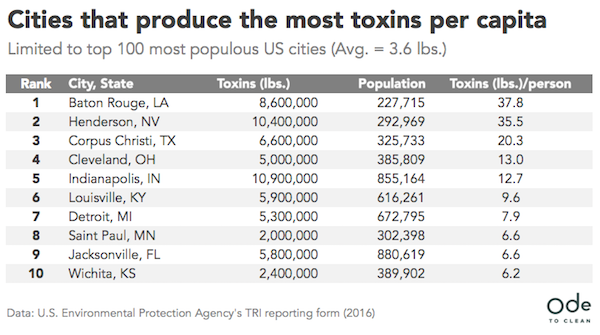
Baton Rouge, La., tops the list here, partly thanks to Exxon Mobile’s massive oil refinery there — the second largest in the country, and one of dozens of plants that skirt the outer limits of the city. Henderson, Nev., which ranks second here, was once a wastewater dump that took 18 years and more than 500,000 environmental tests to get building approval for. Per capita, we see the same cities top the list, with a few extra additions (Cleveland and Wichita).
The industries and companies most responsible
Looking over the lists above, you’ll notice that most of the top cities and counties are in areas known for mining. It comes as no surprise then, that mining is the industry responsible for the highest percentage of toxins released in the United States.
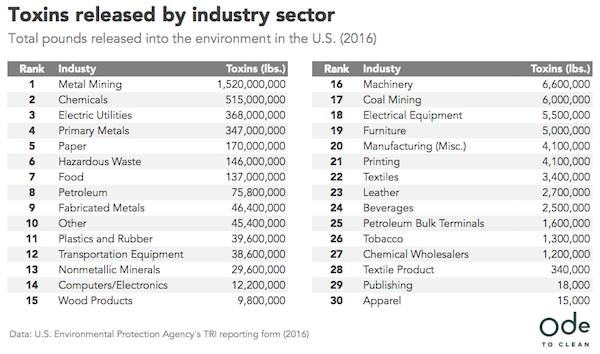
At 1.52 billion pounds, metal mining produces triple the next category, the broadly-defined “chemicals,” which includes such toxins as sulfuric acid, propylene, and sodium carbonate. (The EPA exhaustively lists its industry classifications here). Electric utilities (368 million pounds), paper (170 million), and hazardous waste (146 million) also contribute large amounts of toxins industry-wide.
But how does this break down on a more specific scale?
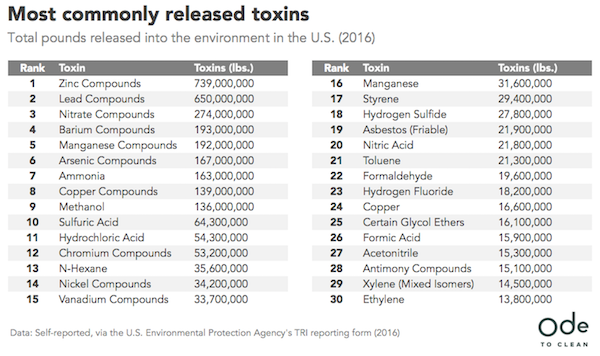
Zinc compounds (739 million pounds), and lead compounds (650 million) — both products of mining — dominate the list of top individual toxins released. Nitrate compounds, which are a common byproduct of fertilizers and human excrement, rank in at 193 million pounds, and another water pollutant, Ammonia (163 million), also ranks high.
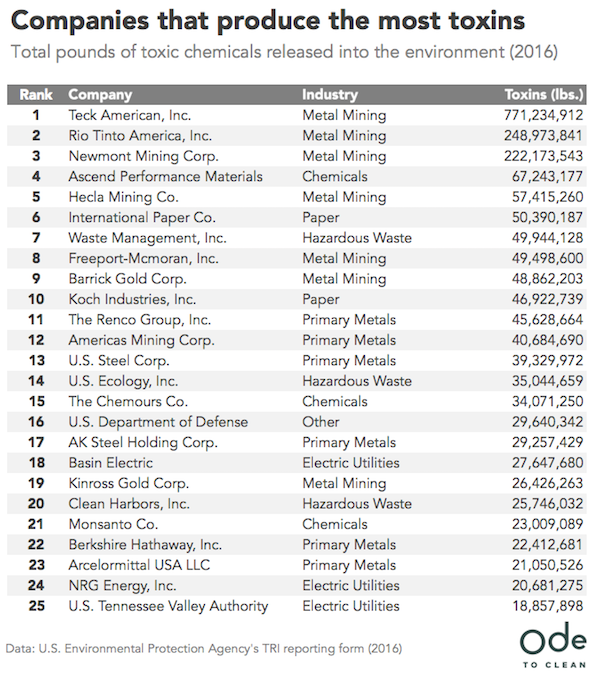
Certain companies, we find, are also largely to blame for mass percentages of the toxins released in the United States. Metal mining corporations dominate this list, but we also see a number of larger holding corps here (Koch Industries, Berkshire Hathaway), as well as government operations (U.S. Department of Defense, U.S. Tennessee Valley Authority).
Collectively, industries in the United States released more than 3.54 billion pounds of toxins into the environment in 2016. That’s the equivalent weight of about 25.3 million American adults — or roughly 8 percent of the entire U.S. population. Nearly half of all Americans live in a county with unhealthy levels of air pollution, and 46 percent of America’s lakes are too polluted to fish or swim in.
This warrants collective action from all of us.
(“The United States of Toxins” was originally published on Ode to Clean’s blog and is reposted on Rural America In These Times with permission. For more information about the Toxic Releases Inventory (TRI), click here. )