The USDA Reports: The Great Recession is Alive and Well in Rural America
Rural America In These Times

Rural America at a Glance is the United States Department of Agriculture’s annual report on the social and economic trends facing rural residents across the country. With few exceptions, its 2015 findings are troubling. Employment has failed to reach pre-recession levels, average incomes have been falling and child poverty is on the rise. Regions dependent on farming, manufacturing and resource extraction are experiencing population declines. Meanwhile, race, ethnicity, family type and lack of education factor heavily in the most struggling areas of rural America. Here is their report.
Slow growth in rural employment
Employment grew more than 1 percent in rural areas during the year that ended in the second quarter of 2015. This is a marked improvement from previous years of very slow growth or decline. Nonetheless, rural employment in mid-2015 was still 3.2 percent below its pre-recession peak in 2007. In contrast, urban employment rose nearly 2 percent in the past year, continuing a trend of consistent growth since 2011, and is now well above its pre-recession peak.
Population decline continues in rural America
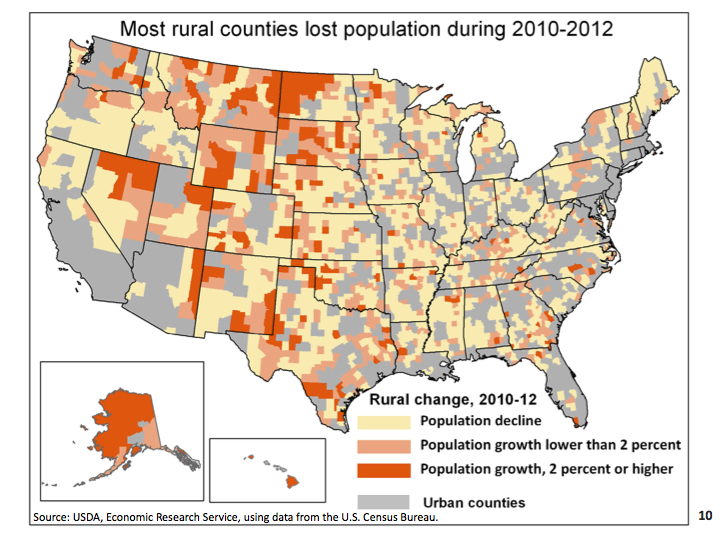
The number of people living in rural counties stood at just over 46 million in 2014 — nearly 15 percent of U.S. residents. However, the population of rural America has declined by 116,000 over the last 4 years, with losses of about 30,000 people in each of the last 2 years. While these declines are small, 2010-2014 is the first period of overall population decline on record for rural America as a whole, and stands in stark contrast with the urban population, which continues to grow by more than 2 million per year.
Not all rural areas have experienced population loss in recent years. Some rural counties have seen population growth, with nearly 700 growing rural counties together adding over 400,000 residents between 2010 and 2014. These counties are concentrated in scenic areas such as the Rocky Mountains or southern Appalachia, or in energy boom regions such as in the northern Great Plains. The 1,300 rural counties losing population since 2010 are widespread in regions dependent on farming, manufacturing or resource extraction.
County population change includes two major components: natural change and net migration. Since 2010, the increase in rural population from natural change (230,000 more births than deaths) has not matched the loss from net migration (346,000 more people moved out of rural counties than moved in).
Nearly 300 rural counties lost population due to natural change during 2010-14. Such natural decrease results from two separate demographic processes operating over several decades: retiree attraction to rural areas, which leads to a more elderly population with more deaths and fewer births; and outmigration of young adults of childbearing age who would otherwise contribute to more births. Retiree attraction dominates in Florida, Arizona, and other Sunbelt locations, while outmigration of young adults is more typical of farm-dependent counties in the Great Plains and Corn Belt.

Poverty remains high in rural areas
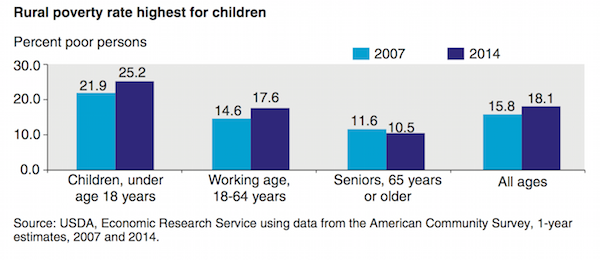
In 2014, the rural poverty rate in 2014 was an estimated 18.1 percent, while the urban rate was 15.1 percent, both slightly below the previous year. Since the early 1980s, poverty rates in rural America have ranged from 13.4 to 18.4 percent, while the urban rate has ranged from 10.8 to 15.5 percent. In rural areas, poverty rates peaked following the recessions of 1980-82 and 2007-09. Recovery from the latter recession has been modest for rural areas overall and stagnant for most rural groups.
Poverty rates for rural children underwent the largest increase during the 2007-09 recession, rising from 21.9 percent in 2007 to 24.2 percent in 2009. Child poverty continued to increase at the start of the recovery and was 25.2 percent in 2014. Poverty for the rural working-age population also increased during the recession and climbed modestly in recovery. Conversely, the poverty rate for rural seniors declined during the recession and has changed little during the recovery.
Children in “deep poverty”
Children are more likely to be “deeply poor” — living in families with an income below half of the poverty level — than are other age groups. In 2007, 9.6 percent of rural children lived in deep poverty, compared to 6.2 percent for the rural working-age population. By 2014, these rates had risen to 11.3 percent of rural children in deep poverty and 7.8 percent for the rural working-age population.
All racial and ethnic groups in rural areas saw an increase in poverty rates from 2007 to 2009, but the Hispanic rate increased most (2.4 percentage points), followed by Blacks (1.6 percentage points). However, Hispanics were the only racial/ethnic group in rural areas for which poverty declined during the recovery. Their poverty rate dropped by 3.1 percentage points between 2009 and 2014, resulting in a lower rate in 2014 (27.5 percent) than at the start of the recession (28.2 percent).
Yet these changes were not equally distributed across age groups. The poverty rate of Hispanic seniors increased from 2007 to 2014, but that increase was concentrated in the recovery period. Poverty rates for seniors decreased for all other groups, but fell most for American Indians and Alaskan Natives. Overall, the poverty rate for Black children had the largest increase and was the highest at the start of the recession (45.4 percent in 2007) and during the latest year of the recovery (51.1 percent in 2014).
Family type has a significant bearing on poverty. Families headed by two adults are likely to have more sources of income than single-adult families with children and are therefore much less likely to be poor. Likewise, single mothers are more likely to work in low-wage occupations that are among the most vulnerable to instability during periods of economic recession. As such, single female-headed families with children had the highest poverty rate among family types in 2007, and that rate continued to rise during and after the 2007-09 recession. In 2014, nearly 5 out of every 10 rural families headed by a woman with related children and no spouse present were poor. In contrast, less than 1 in 10 rural married-couple families were poor in 2014.

Education and poverty in rural America
The educational attainment of people living in rural areas has improved markedly over time, with increases in high school completion rates and in the proportion of residents who have completed at least some college. The proportion of rural adults with a 4-year college degree or more increased by 4 percentage points between 2000 and 2014, and the proportion without a high school diploma or equivalent, such as a GED (General Education Diploma), declined by 9 percentage points. However, the share of the adult population with a 4-year college degree remains far lower in rural areas than in urban ones, and this gap has grown over time.
Growth in the urban-rural college completion gap has occurred even for young adults, who are more likely to have completed high school than older cohorts. Between 2000 and 2014, the share of young adults age 25-34 with bachelor’s degrees grew in urban areas from 29 to 35 percent. In rural counties, the college-educated proportion of young adults rose from 15 to 19 percent.
Minority populations in rural areas have significantly lower levels of educational attainment. About a quarter of adults age 25 and over in the rural Black and Native American/Alaskan Native population, and 40 percent of rural Hispanics, have not completed high school or obtained a GED. These shares are considerably higher than for rural Whites. Lower attainment levels for ethnic minorities may both reflect and contribute to high rates of poverty, as poverty in childhood is highly correlated with lower academic success and graduation rates, while educational attainment is strongly associated with earnings in adulthood.
Children of parents without a high school diploma are much more likely to be poor, since adults with limited education are more likely to be unemployed and to have lower earnings if employed than more highly educated adults. Hence, child poverty rates are much higher in rural counties where many adults have low levels of educational attainment. Child poverty rates grew between 1999 and 2009-13 overall, and child poverty rates in rural counties with a moderate or high share of young adults (ages 25-44) without a high school diploma saw greater increases in child poverty than rural counties with low shares of young adults without a high school diploma.
Improvements in rural educational attainment since 2000 have facilitated a decline in overall rural poverty and rural child poverty. However, other factors — including the recession and an increase in single-parent families — have had the opposite effect. The net result has been an increase in rural child poverty, particularly since 2007. Even after the recession ended, rural child poverty rates continued to increase due to falling average incomes — especially among families with children living near the poverty line — as well as changes in family structure.
(For additional charts, figures and citations see the USDA’s full report here)


