
It’s flu season, and you’re feeling woozy. Have you caught that thing that’s going around?
To find out, head over to Who is Sick?, a Google map-based tool that lets users report their symptoms. Plug in your zip code to find nodes of contagion near you.
Or maybe you’re depressed. Misery loves company. Check the local emotional temperature at We Feel Fine to see data-mined sentiments from blogs, organized geographically.
Maps are everywhere these days. The ubiquity of global positioning systems (GPS) and mobile directional devices, interactive mapping tools and social networks is feeding a mapping boom. Amateur geographers are assigning coordinates to everything they can get their hands on – and many things they can’t. “Locative artists” are attaching virtual installations to specific locales, generating imaginary landscapes brought vividly to life in William Gibson’s latest novel, Spook Country. Indeed, proponents of “augmented reality” suggest that soon our current reality will be one of many “layers” of information available to us as we stroll down the street.
Like other technological innovations, this trend gives with one hand and takes with the other.
For some, mapping has become a vibrant new language – a way to interpret the world, find like-minded folks and make fresh, sometimes radical, perspectives visible. For others, maps portend threats to privacy and freedom of movement. Just see Privacy International’s Map of Surveillance Societies Around the World, which classifies the United States as an “endemic surveillance society.”
Google builds it, people come
Credit former President Bill Clinton for kicking this all off. In May 2000, he signed an executive order removing “selective availability” from the government’s GPS transmission, a protocol that introduced errors into coordinates transmitted to receivers not approved by the military. But it’s Google that has powered the amateur mapmaker craze, by allowing “mashups” between the maps it provides and other data sets.
Google Earth is the crown prince of the search engine’s mapping realm. The downloadable, interactive globe combines the thrill of a first-time flyer – Look, Mom, the people look like ants! – with a near-superhuman sense of control and mobility. With a click you can stand the Earth on its head and shake change out of its pockets. Selecting Google Earth icons can lead you to everything from offbeat video clips to the all-important location of the nearest Starbucks. As the Google Sightseeing blog puts it: “Why Bother Seeing the World for Real?”
The program comes with its own built-in “layers” that pinpoint the locations of parks, landmarks and boundaries. Through its Google Earth Outreach initiative, the company has supported efforts by nonprofits to use the program for advocacy and activism. Early adopters have included the Global Heritage Fund (mapping endangered historical sites), the Jane Goodall Institute (mapping endangered primates) and Fair Trade Certified (mapping sites that protect endangered coffee growers).
While new interfaces make adding content to the program ever-easier, developing a layer for Google Earth still takes time and tech savvy. But working with the company’s 2-D cousin – Google Maps – is easier. Google Maps has allowed (as so often happens on the Web), people’s preoccupations to blossom.
Google Maps Mania, a personal blog run by Canadian Mike Pegg, documents the world as seen from hundreds of different perspectives. You can track UFOs, point yourself toward Mecca, find out where your pet fish is from or browse books by their geographical location. Or, if you’re the Secret Service, you can request that Vice President Dick Cheney’s house be blurred on Google Maps for security purposes. After all, no one likes being watched, right?
Mapping the mappers
Multimedia designer Sha Sha Feng recently completed a Master of Fine Arts project at Hunter College in New York titled “MapaboutMaps,” using Google Earth as a platform to host video interviews about new directions in mapping with geographers, artists and programmers.
“I’m a home-grown cartographer,” artist Nina Katchadourian told Feng in one interview. “If my paying attention to something creates a situation where someone else suddenly pays attention to something and that makes things a little active and interesting for them, then I’m happy.” Katchadourian’s work remixes printed maps in tactile ways that reveal a more subjective experience of geography – such as Coastal Merger, a map that glues East Coast to West Coast to reflect the artist’s bicoastal life experience.
Feng was particularly interested in examining the role maps can play in building community. She interviewed Wendy Brawer, the founder of Greenmap Systems, a website that engages local mapping teams to chart their communities’ natural and green living landmarks, including farmers markets, organic food producers, fair trade shops, indigenous sites and the best spots for star-gazing. “Maps are very personal objects,” says Brawer. “People look for themselves on them.”
Participatory mapping tools have “opened the world of maps from a few to many,” says Feng. “Maps are powerful tools. Many people take them as fact, but they tell the story that the creator wants you to see. Grassroots communities and artists welcome this technology because it allows their voices to be heard.”
Feng is currently working with artist Andrea Polli on a project called 90ºS, which maps weather changes, images and soundscapes from McMurdo Station in Antarctica, where scientists are gathering global climate data. Feng notes that Google Earth data for the region is relatively scarce compared to the geographical information available for urban centers – a form of virtual gentrification.
Google isn’t the only site offering mashups – just the most high-profile one. While MapQuest is still the number one site for those looking for simple directions, Microsoft’s Virtual Earth and Yahoo! offer mashup tools too. And content-focused sites like Flickr and Twitter encourage users to attach their creations to locations, creating new personal geographies.
But while mashups and social software have opened the horizons of cartographic creativity, the maps themselves are still proprietary – Google and others license them and make them available to users as part of their marketing strategy.
The rise of the neogeographers
In contrast, projects like OpenStreetMap eschew commercial or government-owned maps in favor of data generated directly by users. Volunteers generate “traces” by walking or cycling routes while carrying a GPS tracker, and then upload the results and edit them online. Following the precepts of open source software and Wikipedia, the project encourages collaboration and makes the results free for others to use. The site has a lively discussion board populated by amateur geographers, many of whom organize “mapping parties” to survey specific locations.
Watching the watchers is, again, a popular theme for do-it-yourself mappers. For years, the Surveillance Camera Players mapped the location of cameras around New York City, using them to stage performances and walking tours. The group collaborated with the Institute for Applied Autonomy on its iSEE project to develop a Web-based map that lets users plot their routes along “paths of least surveillance.”
Terminal Air, another project of the institute, maps the movements of planes suspected to have been involved in the CIA’s extraordinary rendition program.
Radical geographers sometimes skew geographical conventions to make points. At Worldmapper, maps are morphed according to the subjects they treat. A map of “often preventable deaths” presents an Africa that resembles a lumpy bunch of grapes, while Latin America stretches skinny and Dalí-esque. The distortions represent large numbers of deaths.
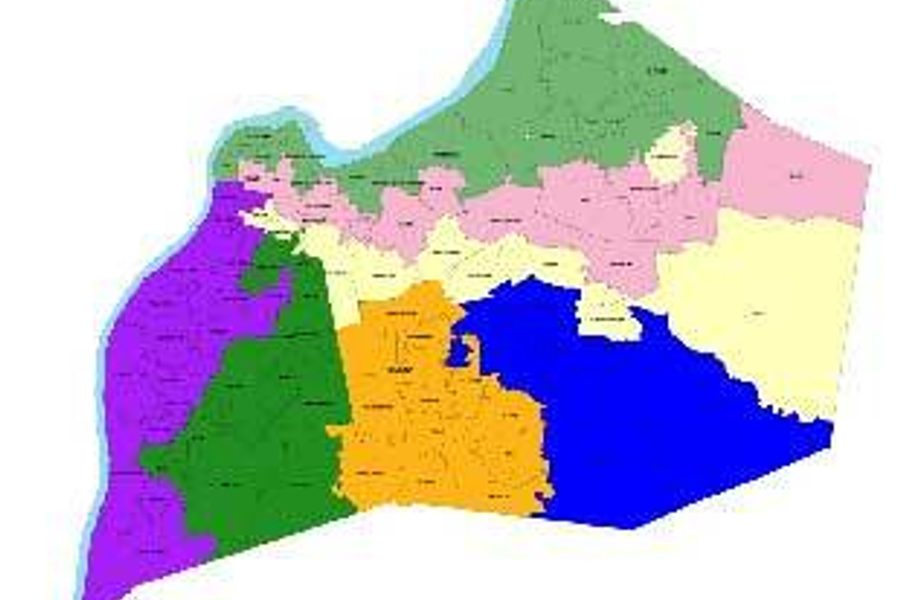
Another map, from the Doctors of the World network, fills the familiar shapes of the continents with ratios of inhabitants per doctors. While the U.S. ratio averages around 400: 1, much of Latin America hovers just below 1,000:1, while regions of South Africa top out at 50,000: 1.
Complex networks
Enthusiasm for mapping the physical world online is matched by zeal for mapping territories so large and abstract as to be almost unimaginable. Computer networks are the most common subjects for data-intensive mapping projects. But the term “networks” is also used to describe many other kinds of relationships.
The Visual Complexity website, curated by interaction designer Manuel Lima, provides a gorgeous and perplexing gallery of maps that represent complex networks. One intimate map tracks the structure of adolescent sexual networks among 800-plus Midwesterners, branching out in long chains of pink and blue bubbles.
In another, Linkfluence’s Map of the Political Blogosphere, blue bubbles represent progressive bloggers, red conservative, with purple and yellow scattered in between and at the periphery. A rat’s nest of links reveals that the ideological spheres talk mainly among themselves, with occasional crosslinks for critique and finger-pointing. Click on a blog and you’ll see its popularity.
Similar popularity contests are commonly available on personal social network sites like Facebook. Users can map themselves among networks of friends, assessing, at a glance who is the most connected. In the parlance of social network analysis, this cluster of connections is our “ego network” – a fitting term for the personalized mapping environment.
In many ways, these mapping tools are re-locating us as the center of our personal universes. We no longer go to maps to find out where we are. Instead, we tell maps where we are and they form around us on the fly, a sensation that can be comforting or stifling. After all, while finding the right map can orient you, having dozens can threaten to tip the signal-to-noise ratio toward cacophony.
On balance, though, the democratization of mapping and visualization tools generates possibilities for self-expression and social action. Two decades ago, postmodern theorist Frederic Jameson argued that developing new maps would be central for activists hoping to grapple with the emerging global business and communication systems. “[The] incapacity to map socially is as crippling to political experience as the analogous incapacity to map spatially is for urban experience,” he wrote.
The tools are now available. The question now: Where do we go from here?