In 2012, Steve Lovelace, an artist, writer and photographer based in Texas, designed the above map to accompany Corporate Feudalism: The End of Nation States—a self-published blog post in which he likens socioeconomic trends in the early 21st century to those in the Middle Ages and Frank Herbert’s sci-fi classic, Dune. Lovelace writes, “We are witnessing the end of the nation state and the rise of corporations that control the world’s resources like feudal lords.”
It’s an old idea, but one that’s getting new legs. For starters, though we often differ on who or what to blame, it’s become clear that income inequality isn’t something Bernie Sanders made up for kicks. Millions of Americans are living paycheck to paycheck while Wall Street sets records. The oil, pharmaceutical, agribusiness and telecommunications corporations that already have their respective global sectors cornered are merging and consolidating even further. On the home front, conditions vary but millenials (somehow responsible for most of the planet’s problems) are putting forming families on hold, routinely spending 50 percent or more of their stagnant wages on smaller and smaller apartments, defaulting on student loans and sharing each others Netflix accounts — all while getting daily reminders that robots haven’t started replacing the good jobs…yet. (At last count, 44.2 million Americans owe $1.28 trillion in college debt and the deliquency rate stands at 11 percent.) On the other end of the age spectrum, half of American baby boomers have less than $100,000 saved for retirement, and 25 percent have already tapped what little they do have for non-retirement related expenses.
But how bad is it really? How far-fetched is a world in which multinational corporations wield more power than the nation states that cultivated them? How close are we to a new age where a “free” citizen’s access to food, shelter, water or healthcare is influenced less by the policies of an elected government, and more by the whims of a few wealthy, all-powerful oligarchs?
Funny you should ask.
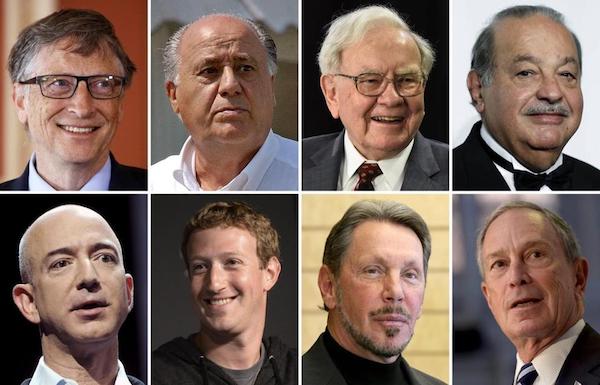
As of January 17, eight men own as much wealth as half the world. Released to coincide with the annual meeting of political and business leaders last month in Davos, Switzerland, a new Oxfam report reveals Bill Gates, Amancio Ortega, Warren Buffett, Carlos Slim, Jeff Bezos, Mark Zuckerberg, Larry Ellison and Michael Bloomberg are worth a combined $426 billion. The poorest half of humanity — 3.6 billion people — own an estimated $409 billion.

These eight men own as much wealth as the world’s poorest 3.6 billion people. (Photo: European Press Photo Agency)
While shocking to think about, headlines like these hardly get a second glance these days. In the first week of Donald Trump’s presidency, for example, the 10 richest Americans (many with names you’ll recognize from the last paragraph) gained an easy $16 billion in new wealth. For those who punch clocks, such sums are hard to fathom. Indeed, it’s hard to imagine that only eight short years ago this same Wall Street needed a $700 billion loan from the American taxpayer in order to prevent a global financial catastrophe that threatened to make the Great Depression look like Sesame Street. The cause? An arrogant, elite banking culture of greed, rampant speculation and a total lack of accountability. (Only one banker went to jail and we’re still bailing out some of the biggest banks.)
In order to minimize the chances of this happening again, President Obama signed the Dodd-Frank Wall Street Reform and Consumer Protection Act in 2010. At the time, it was widely hailed by most Americans as better than nothing. (A few hedge-fund managers complained publically, which made everybody else feel like progress might be happening.) Last week, however, President Trump disagreed and signed an executive order to begin rolling back parts of the law before it was ever fully implemented. The markets, of course, rallied.
Much of this is old news, but it brings us to the crux of American dysfunction — the intersection of money and politics and a Supreme Court case known as Citizens United v. Federal Election Commission. Quick recap: In 1988, the conservative 501(c)(4) nonprofit organization known as Citizens United sued the FEC to change a law that barred corporations from paying for political ads prior to an election. They won and now public office is a multibillion dollar industry.
The point of this post, however, is not to stoke partisan outrage. (Donald “drain the swamp” Trump did hire David Bossie, the president and chairman of Citizens United, to be his Deputy Campaign Manager and his cabinet is the wealthiest in history…but this stuff has been going on for decades.) Rather, in an ideal world, the glaring absurdity of 21st century finance would help illustrate what precious little our rabid separateness has accomplished in recent years (and thusly stoke bipartisan outrage). We’ve been divided, compartmentalized and split into warring factions by two supposedly different ideologies. Yet regardless who wins, the rich get richer and corporate power grows.
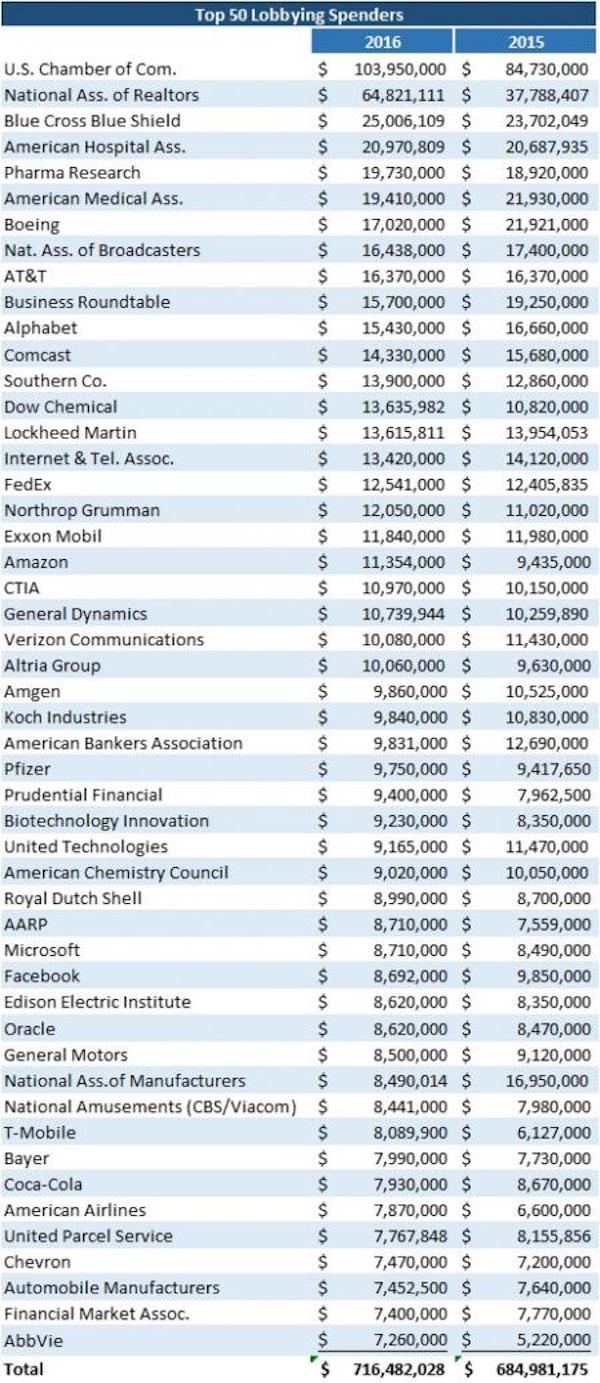
Case in point: According to new data from the Center for Responsive Politics, these 50 companies spent more than $716 million lobbying Congress and the federal government last year:

(Chart: Center for Responsive Politics)
In their assessment of the findings, The Hill reports:
Some of the companies and groups that boosted their lobbying spending last year did so in response to major legislative and regulatory fights.
Dow Chemical, which is seeking to merge with DuPont, boosted its advocacy spending by 26 percent, to $13.6 million…
Other companies and business groups dialed back their lobbying spending last year, in part due to the lack of legislative activity on Capitol Hill…
The American Petroleum Institute, Qualcomm, America’s Health Insurance Plans and George Soros’s Open Society Policy Center all slashed spending on advocacy in 2016. The Grocery Manufacturers Association, which scored a win on a GMO labeling law midway through 2016, reduced its advocacy 44 percent from the year before, spending $4.7 million.
New year, new data
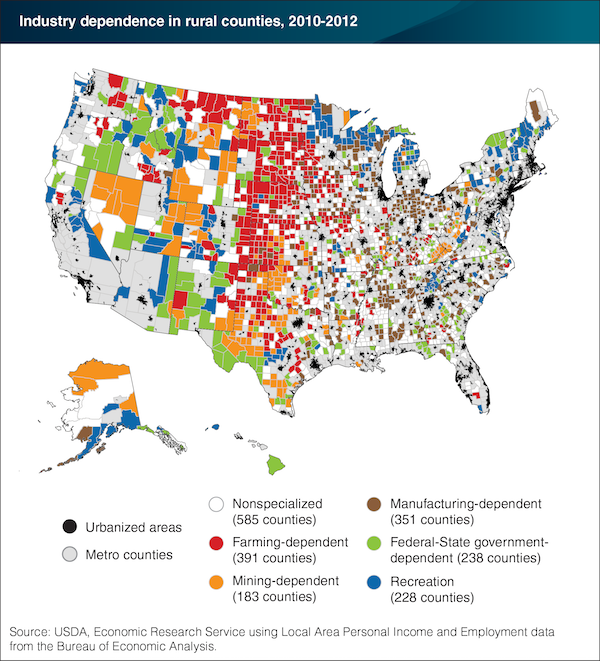
In other news, the Department of Agriculture’s Economic Research Service (USDA-ERS) released its annual Rural America at a Glance report and it includes the following infographic detailing how industry is distributed nationwide:

There’s nothing too saucy in this report, but it provides a good overview of regional employment statistics. Here’s an excerpt:
Recent trends in employment by industry have not differed greatly between rural areas and urban areas. Mining employment (though still a small component of total employment) more than doubled from 2001 to 2014 in both rural and urban counties, reflecting a boom in unconventional oil and natural gas production. Of the 537 counties with substantial oil and gas production, 444 are rural and 93 are urban. Over 2001-14, the much larger producer services sector has seen employment growth of more than 20 percent in both rural and urban areas. Between 2001 and 2010, manufacturing employment fell by close to 30 percent in both rural and urban areas, reflecting the impacts of trade competition, rising labor productivity, and the Great Recession. While manufacturing employment has recovered some since 2010, it remains well below levels of the early 2000s. The greatest rural-urban difference in jobs growth is in recreation employment, which has risen markedly faster in urban areas; this may reflect both overall population growth in urban areas and their success in attracting younger adults.
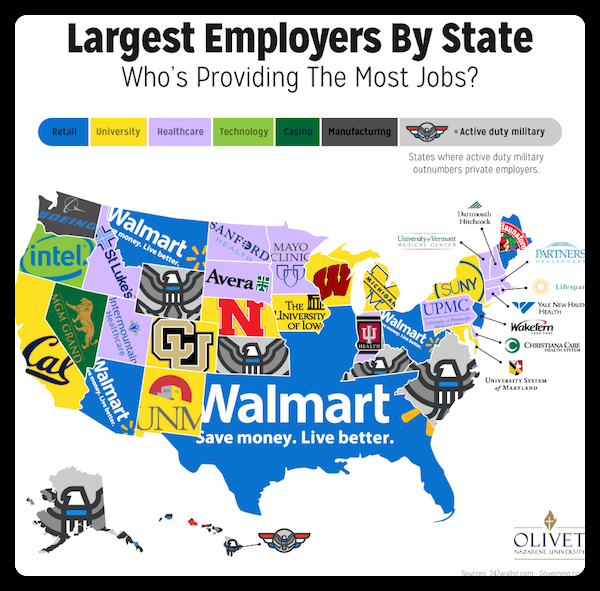
Lastly, Olivet Nazarene University recently released this map and report of the largest employers in each state:

Clearly, if this is the dawn of what Lovelace calls corporate feudalism, Walmart is off to a roaring start.


